


See Everything. Guess Nothing.
Real-time dashboards and automated reports give operations leaders, finance teams, and executives a shared view of what’s happening in the field, updated as work is completed, not days later.
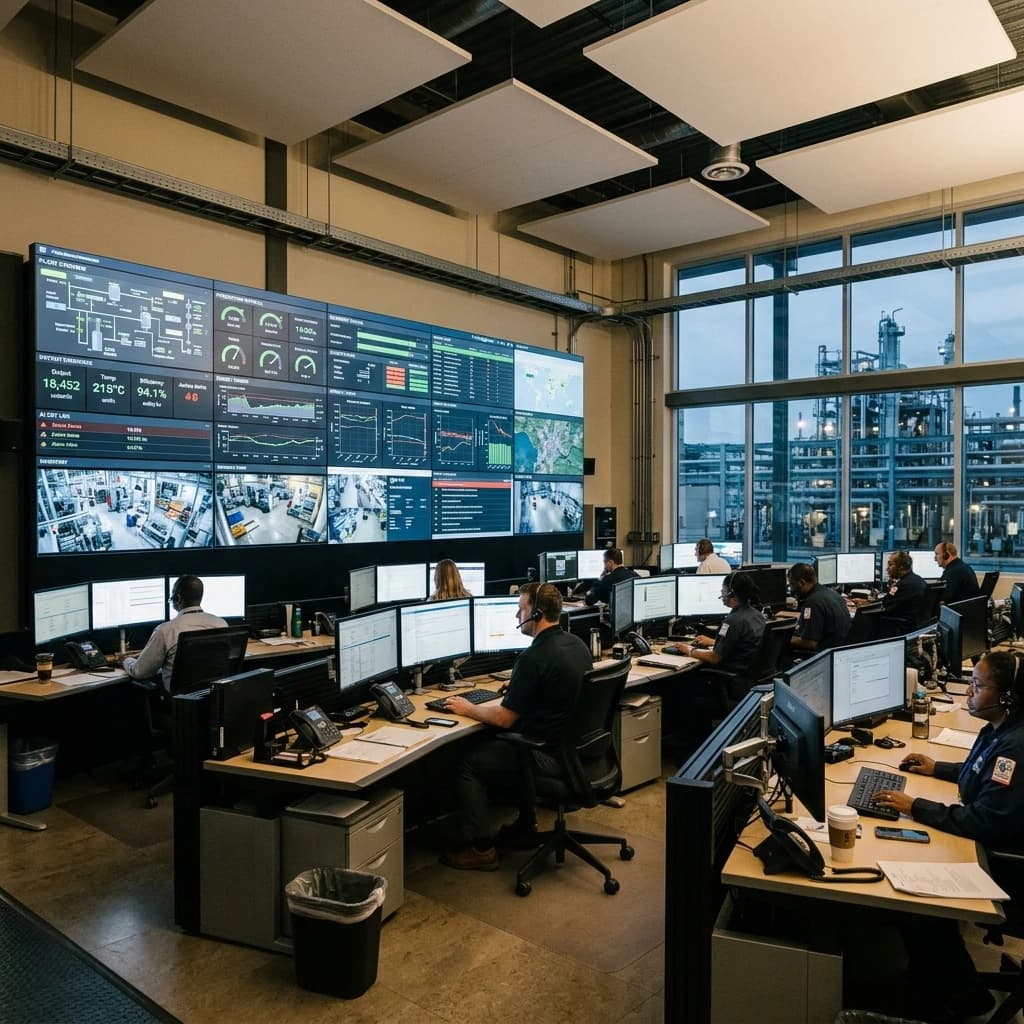
You Can't Manage What You Can't See
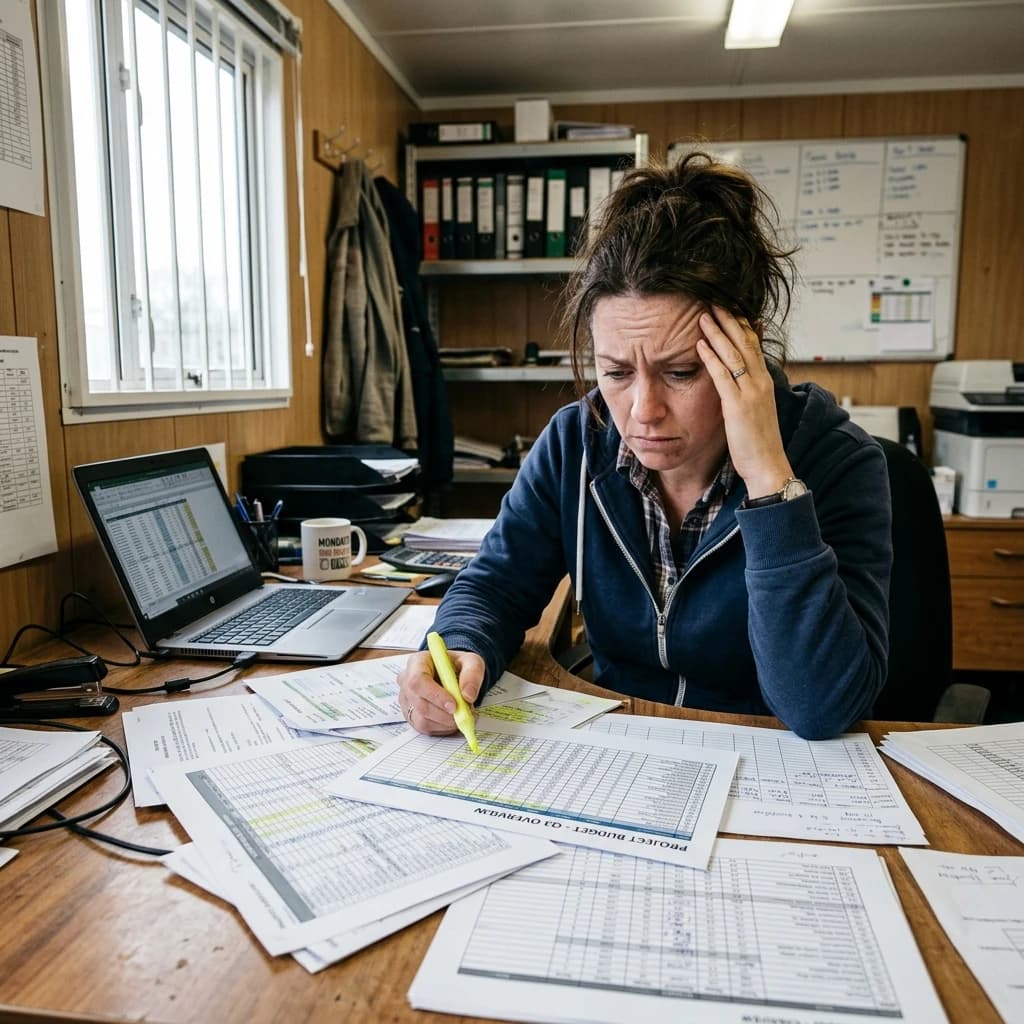
Field data lives in spreadsheets, texts, and whiteboards, never in one place at the same time.
Weekly reports are already stale by the time they reach leadership.
Supervisors spend hours compiling updates instead of managing operations.
Finance can’t reconcile jobs completed versus jobs billed without manual cross-referencing.
How Analytics & Reporting Works
Automatic Data Collection
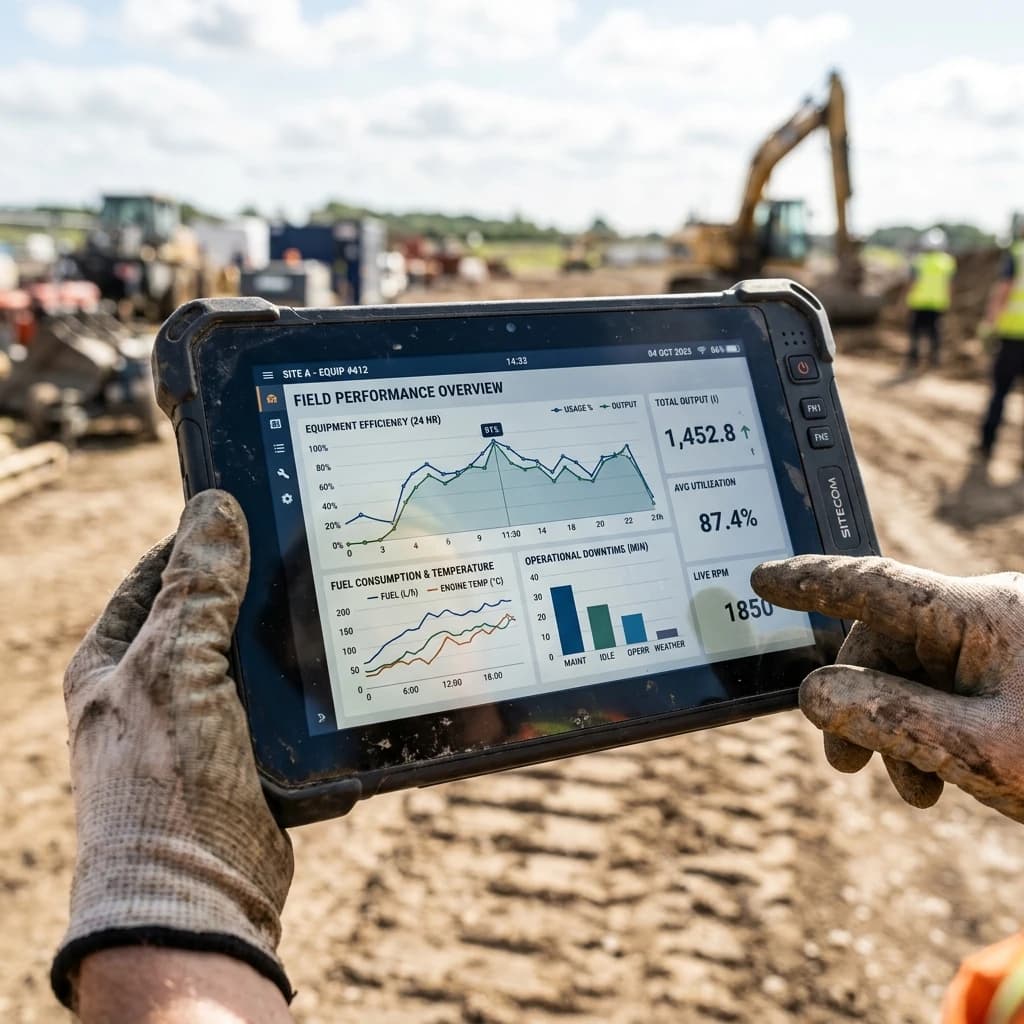
Every field action (job completion, inspection result, ticket submission) is captured automatically. No manual entry required.
Live Dashboards
Role-specific dashboards update in real time. Ops sees crew status. Finance sees billing pipeline. Execs see KPIs.
Scheduled & Ad-Hoc Reports
Automated reports delivered on schedule, plus drill-down capability for any metric, any time frame, any crew.
Built for Operators
Field-Generated Data. Not Re-Keyed Data.
Unlike BI tools bolted onto legacy systems, OpsFlo analytics are built on data captured at the point of work, which means they’re accurate, timely, and complete.
Stop Guessing.
Start Building.
OpsFlo is the single source of truth for industrial operators. Stop losing revenue to disconnected field data.